Chicago’s Weather and Market Begins to Cool Off
This month, we are going to examine the market covered by the MRED MLS listing service (basically Chicagoland) to look for trends. MRED tracks data on a weekly basis to compare 2020 to 2021 statistics. This gives us a better idea of whether any market slowdown is simply seasonal like most years or the start of an overall downward trend in the Chicagoland real estate market.

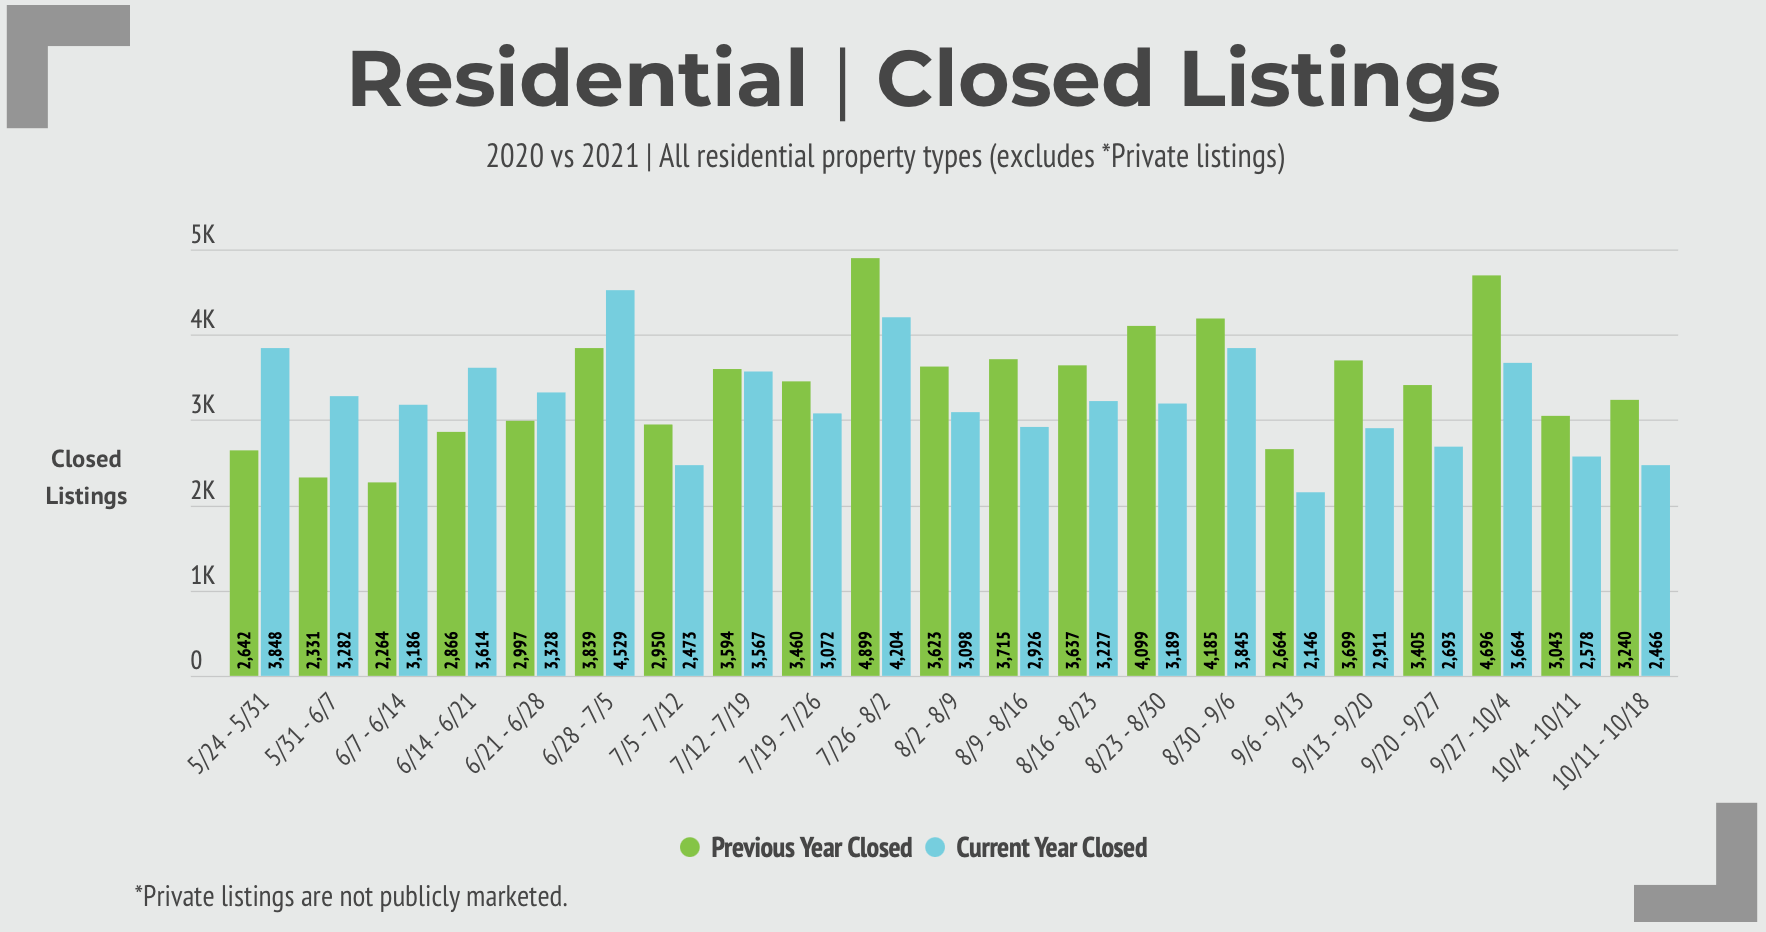
Closed Sales
You can see a downward trend as we reported last week. For week of October 11th, 3,240 homes closed in 2020 versus 2,466 the same week in 2021.

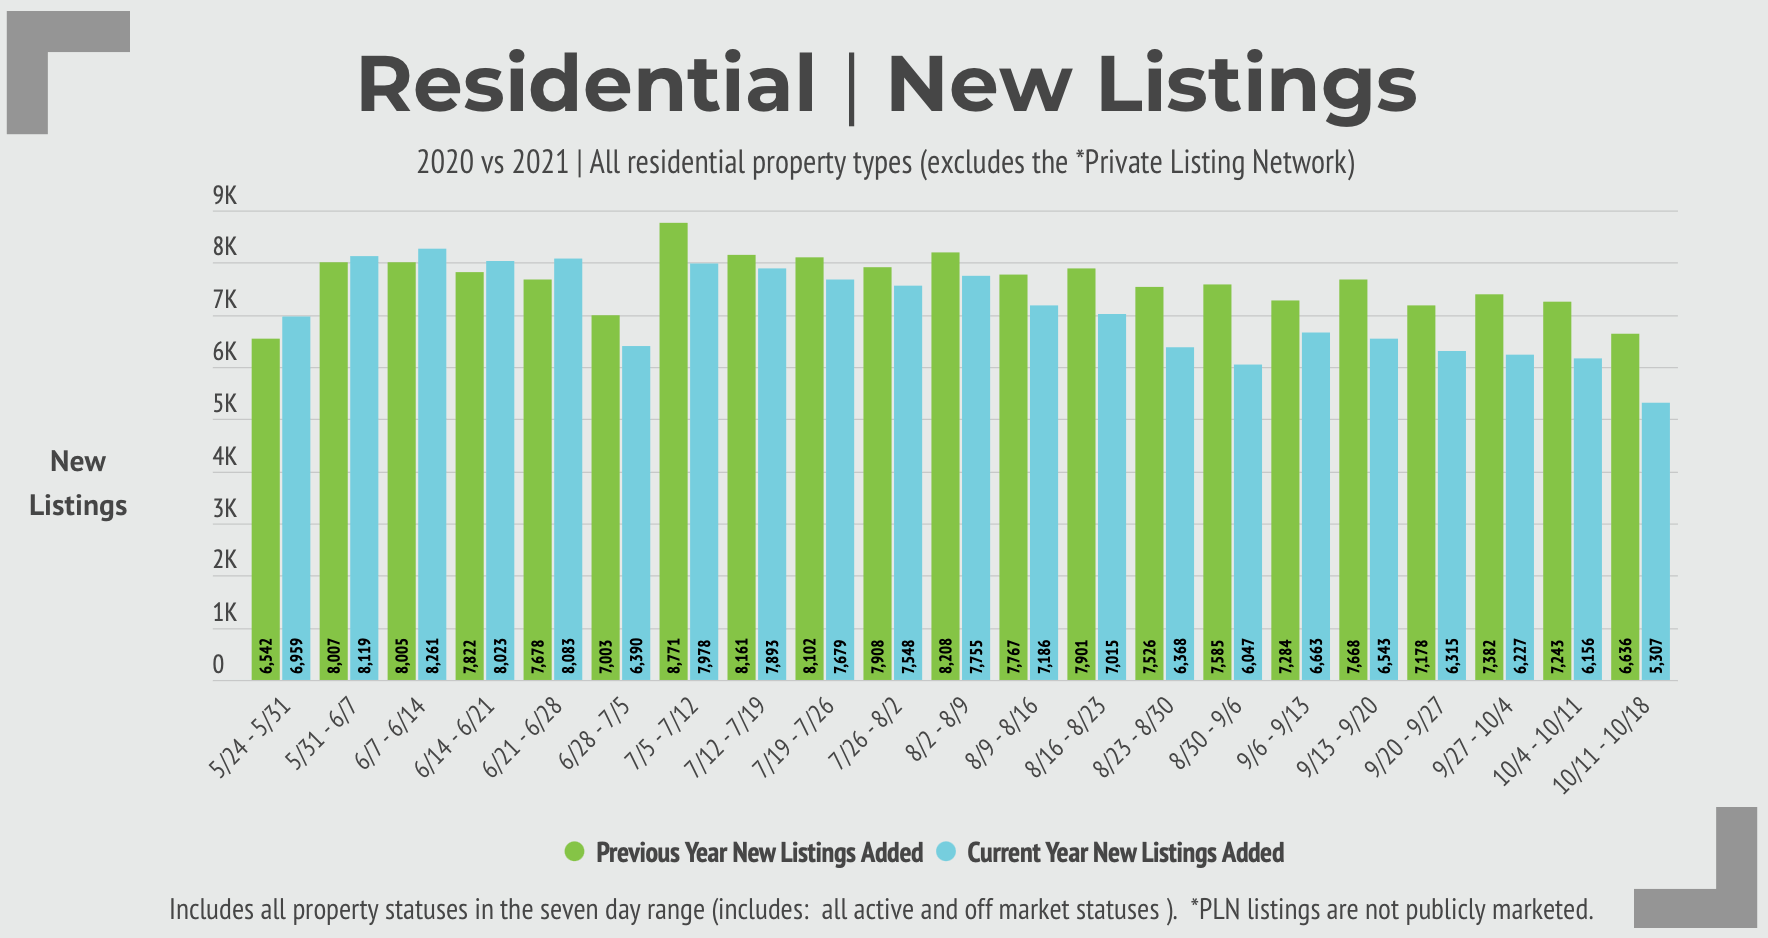
New Listings
New listings are off also, for week of October 11, 6,636 homes were listed last year versus 5,307 now.

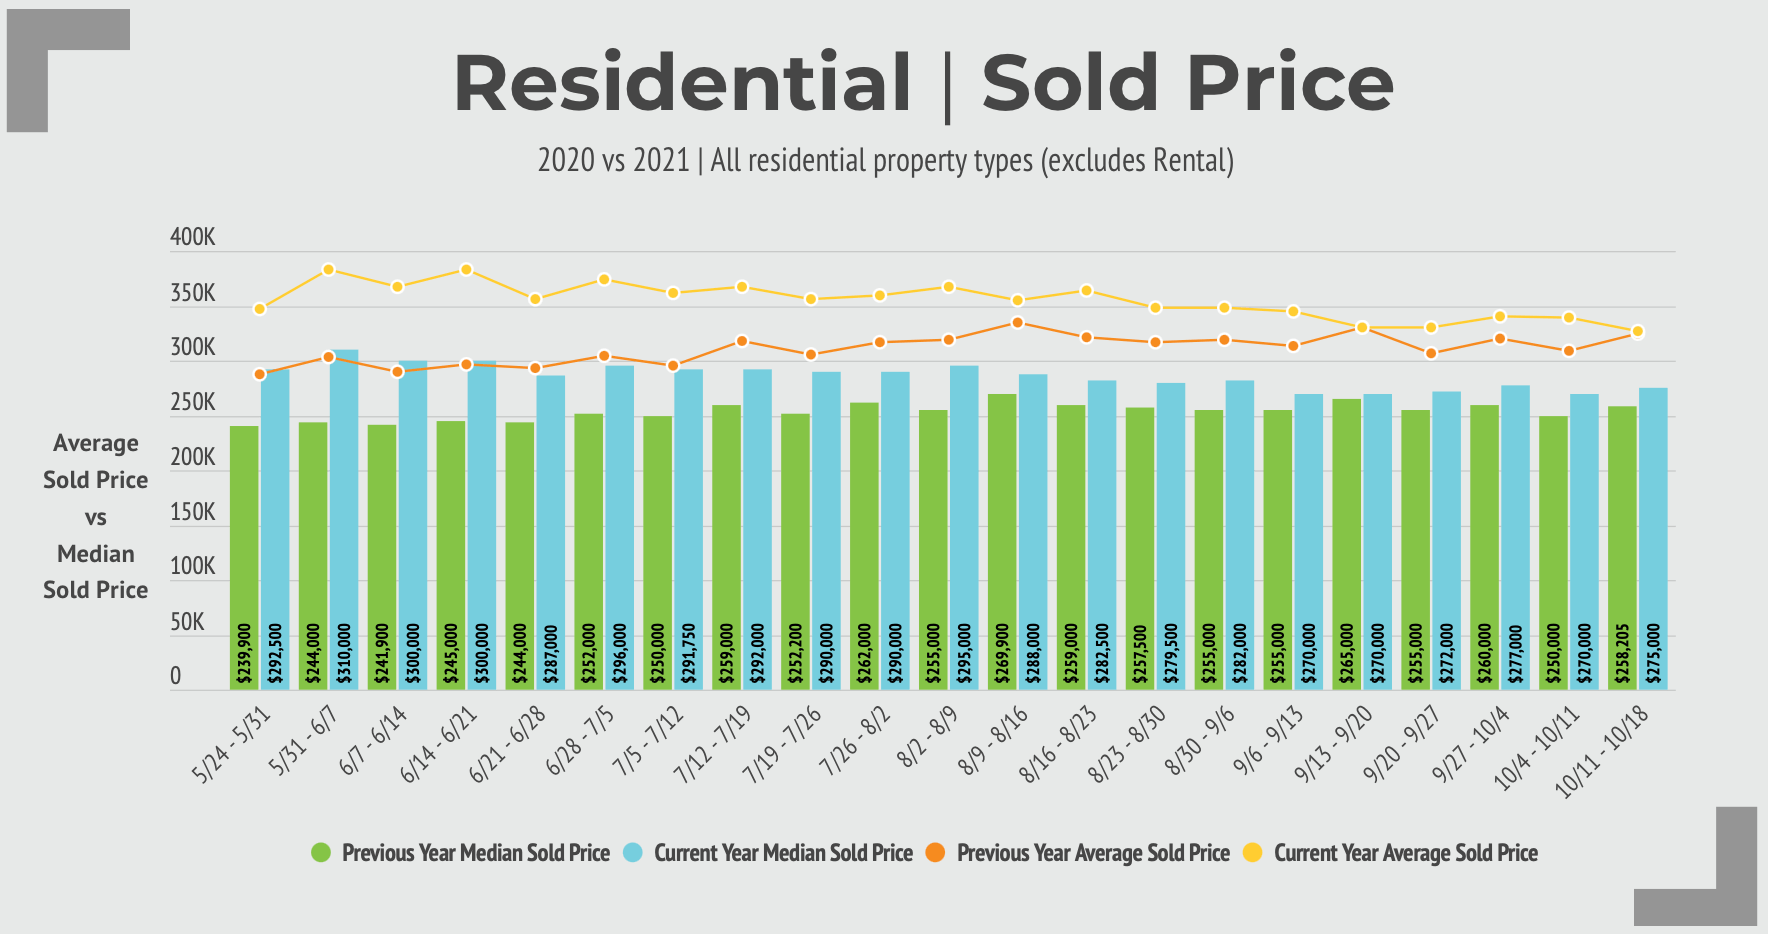
Sales Prices
The median sales price for week of October 11 $275,000 still tops 2020’s $258,000. But consider that homes that closed in the week of October 11 probably went under contract in August, so we won’t see any slowdown in the stats for at least another month.

But look at average sales price. The highwater mark for average sales price was week of May 31st of about $383,000. This topped the same week in 2020 by 25% (and again would have reflected deals going under contract in March/April 2021). For the week of October 11, the average sales price for 2020 and 2021 is the same.
We can also look at the neighborhood data and see a cooldown. In Lincoln Park condos, inventory for September 2021 is off 36% and median sales price down 15%. Market time is up 27%. You can examine your own town or neighborhood in the report we are providing.
